AI Visibility Index — Cross-Vertical Benchmark Table From 4 Real Client Brands Inside Truffle
AI Visibility Index benchmark table from 4 real anonymized client brands tracked inside Truffle. Index range 21.9 → 57.3. Compact per-brand profiles + KPI table. Screenshots included.
About this report. Original research from the team behind Truffle, the AI visibility tracker we use to measure citation rates across ChatGPT, Claude, Gemini, Perplexity, AI Mode, and Google AI Overview. Every screenshot in this article is from a real client brand's dashboard inside the platform — client names and logos redacted with Gaussian blur + Truffle-branded overlays, every stat and AI-generated insight preserved exactly as the tool surfaces them.
The full benchmark table (all 4 brands, one glance)
Extracted directly from the Competitors view (30-day filter) and Dashboard headline of each brand on 2026-06-30:
| Slot | Vertical | Geo | Visibility Index | Mention rate | Avg position | Link rate |
|---|---|---|---|---|---|---|
| Brand A | Global hotel chain | EU | 57 / 100 | 63.0% | #3.5 | 56.1% |
| Brand B | DTC footwear | EU/Global | 28.8 / 100 | 30.1% | #4.1 | 29.2% |
| Brand C | Gift e-commerce | DE | 21.9 / 100 | 27.4% | #5.8 | 27.3% |
| Brand D | Travel / ski | EU | 57.3 / 100 | 63.3% | #3.1 | 62.1% |
Methodology note. Visibility Index is a composite 0–100 metric Truffle computes from mention rate + link rate + average position + share of voice across all 6 tracked engines (ChatGPT, Claude, Gemini, Perplexity, AI Mode, Google AI Overview). Mention rate / Avg position / Link rate come from the Competitors view's "Brand vs. Competitors" KPI strip on the 30-day filter — we standardize to that window across all 4 brands for consistency. Dashboard headline scores can differ slightly (different aggregation window); we use Competitors 30d throughout.
What patterns emerge from the numbers?
Three shape observations from the numbers alone (no verbatim SITUATION ANALYSIS quotes in this piece — for that read the linked deep-dives):
Two clusters, one gap. Brand A and Brand D land within +0.3 Index points of each other despite being different verticals (hospitality vs travel/ski) — both are category leaders in a sector where AI referral density is high. Brand B and Brand C land ~28 Index points below the top cluster, again despite being different verticals (footwear vs gift e-commerce) — both are non-leader positions in verticals where AI referral density is meaningful but the brand's own share of voice is mid-band.
Same Index, different KPI mix. Brand A hits Index 57 with mention 63.0% + link 56.1% + position #3.5. Brand D hits Index 57.3 with mention 63.3% + link 62.1% + position #3.1. Brand D's link rate is meaningfully higher than Brand A's despite similar mention rates — meaning when Brand D gets mentioned, it gets clicked-through-to more often. Two brands with matching composite scores can have materially different traffic-conversion economics.
Position matters at a different scale than mention rate. Brand C's avg position of #5.8 is markedly worse than the others — a 2+ position gap versus Brand D's #3.1. In AI answer surfaces, position #3-4 vs #5-6 is the difference between "in the citation panel by default" vs "only in the expanded panel most users don't open." That's a bigger practical drag than the ~5-point mention-rate difference between Brand B and Brand C would suggest.
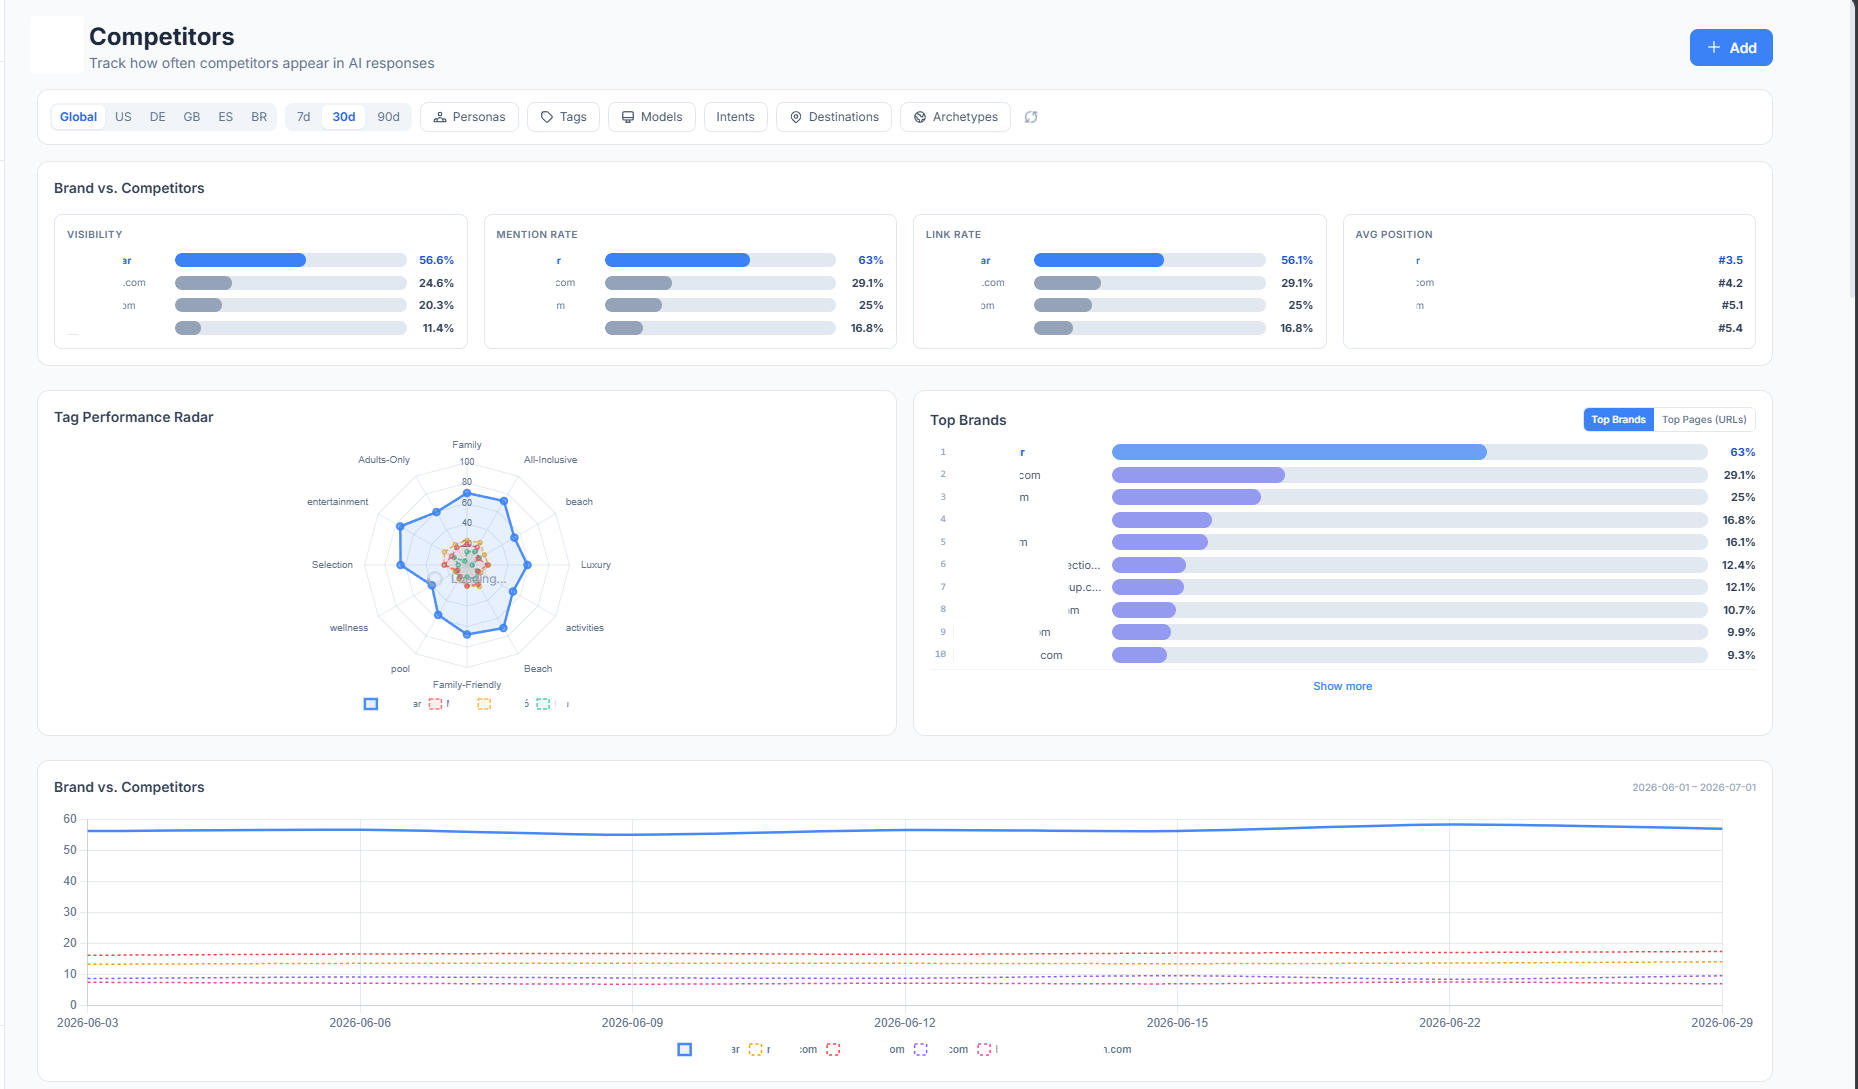
The Competitors view above (Brand A) shows the per-KPI competitive frame we use to extract these numbers. Each brand's 4-KPI strip looks structurally similar in the platform — the numbers differ, the layout is the reference.
Run this same analysis on your brand
Multi-engine tracking + AI Intelligence + Competitors view — 15 minutes setup.
Book a demo →Compact per-brand profiles
Each profile is deliberately short. For the SITUATION ANALYSIS + finding-text-level detail, use the linked companion pieces.
Brand A · Hospitality EU
- Dashboard headline: Visibility Index 57/100.
- 4 KPIs (Competitors view · 30d): mention 63.0% · link 56.1% · position #3.5.
- Vertical shape: category leader with mature Wikipedia + tier-1 publication footprint. AI engines converge on the brand for head-term hospitality prompts; adjacent-segment gaps exist.
- Deep-dive on this brand's per-engine profile (specifically Perplexity vs ChatGPT): engine divergence piece. For the underlying off-site anchoring pattern that drives this shape, see AI brand mentions.
Brand B · DTC Footwear EU
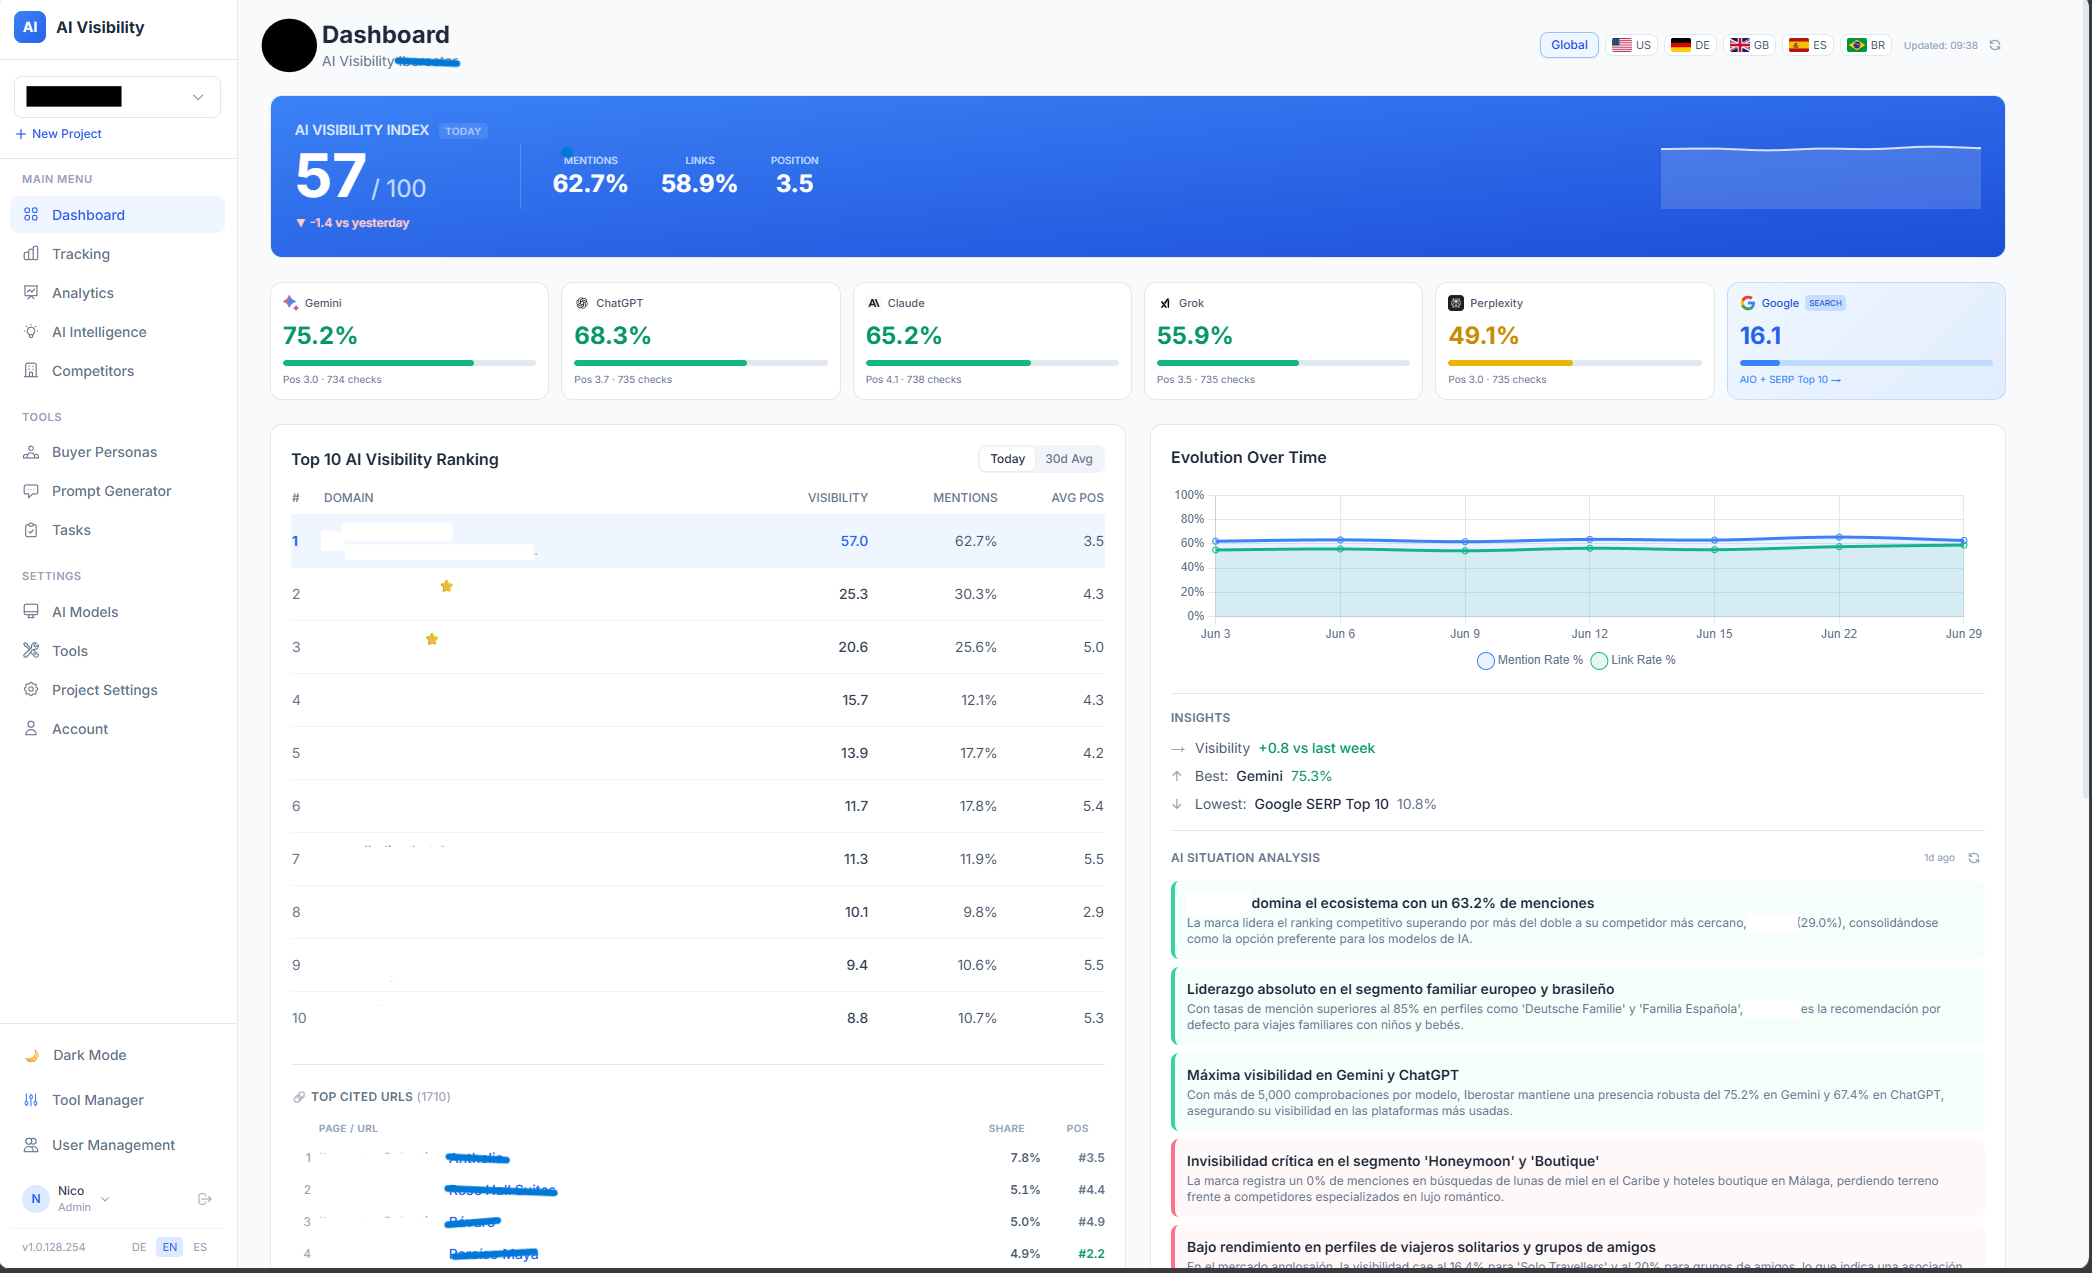
- Dashboard headline: Visibility Index 28.8/100.
- 4 KPIs: mention 30.1% · link 29.2% · position #4.1.
- Vertical shape: design-forward niche authority. Strong on conversational-AI engines (Claude, ChatGPT); explicit Perplexity + Gemini weaknesses surfaced by the AI Intelligence view.
- Deep-dive: engine divergence piece. To baseline your own brand against similar patterns, start with the free check.
Brand C · Gift e-com DE
- Dashboard headline: Visibility Index 21.9/100.
- 4 KPIs: mention 27.4% · link 27.3% · position #5.8.
- Vertical shape: language-and-vertical-locked authority in German B2C DIY/workshop categories. Composite Index caps at ~22 because B2B and productivity-focused segments haven't been built out yet — editorial gap, not off-site authority gap.
- Deep-dive on this brand's segment-level citation gaps: segment citation gaps piece. The Truffle AI Brand Tracking view surfaces the specific missing off-site anchors identified for this brand's B2B segment.
Brand D · Travel / Ski EU
- Dashboard headline: Visibility Index 57.3/100.
- 4 KPIs: mention 63.3% · link 62.1% · position #3.1.
- Vertical shape: extreme sub-segment ownership in one specific vertical (last-minute ski trips in EU languages) that also generalizes to solid all-around performance on the composite Index. Adjacent-segment gaps (families-with-children) drag ceiling.
- Deep-dive: segment citation gaps piece.
How do you read your own Visibility Index against this table?
The Index scores here are individual data points, not vertical benchmarks. But the shape of the KPI mix is generalizable. When reading your own Index:
- Anchor to the KPI mix, not just the composite. Two brands with matching Index can have very different traffic economics — check mention-vs-link ratio, and check average position.
- Compare Index to vertical maturity, not to absolute scales. A 21.9 in a tight-authority B2C DE vertical is a different signal than a 21.9 in hospitality or travel — the "top of the reachable Index" varies materially by vertical AI-referral density.
- Segment-level 0s cap composite ceilings. If your AI Intelligence view flags any "critical invisibility" segments, your composite Index has a mechanical ceiling equal to (weighted average across all covered segments) — closing zeros lifts more than optimizing near-median segments.
- Position #3.5 → #5+ is a bigger practical gap than mention rate ±5pp. Prioritize position lift when it's the drag.
- Re-benchmark monthly on rolling averages. Daily deltas exist in the Dashboard but noise; the 30-day rolling filter in the Competitors view is the reliable read.
Try this on your own brand
- Create your Truffle account — set up brand + category + 5–10 competitors across all 6 engines.
- Dashboard view for headline Index. Read alongside the 30-day rolling KPI trend.
- Competitors view (30d filter) for the 4-KPI comparative table. This is the same view we extracted the numbers above from.
- Read the AI Intelligence view for the "why." Composite Index is the outcome; per-segment findings are the causal chain.
- Re-measure at 30 / 60 / 90 days.
See your own AI Intelligence SITUATION ANALYSIS
Strengths · Weaknesses · Insights — generated automatically from 90 days of multi-engine tracking on your brand.
Book a demo →External validation (cross-reference)
Two datapoints from macro AI-referral tracking help frame the numbers above:
- Similarweb · TechCrunch (July 2025) — 1.13B AI referrals across tracked web in June 2025; ChatGPT accounts for >80% of AI referrals to top-1,000 sites. (source)
- Opollo 2026 AI Search Benchmark — 312 B2B tech firms tracked: AI-referred visitors converted at 14.2% vs Google organic 2.8% (~5× conversion advantage). (source)
These external framings say AI referrals are big and high-quality — this piece shows what the intra-brand distribution looks like when 4 real client brands are measured on the same platform, same day. Want your own number? Check where your brand stands with our ChatGPT Visibility Checker. Related pieces: engine divergence deep-dive · segment citation gaps deep-dive.
FAQ
Is Index 57 "good" or "bad"?
Depends on vertical + brand position + your competitor set. Brand A and Brand D both hit ~57 as category leaders in verticals with mature AI-referral density. In a tight-authority niche vertical, ~22 (Brand C's Index) is a defensible mid-band position, not underperformance. Compare within-vertical, not across.
Why do we standardize to Competitors view 30d for mention/link/position?
Dashboard headline aggregations use different windows and don't always match the Competitors view. For internal consistency across the 4 brands, we anchor to Competitors 30d — one aggregation, one filter, all 4 brands aligned.
Can you extrapolate a benchmark for my vertical from these 4 brands?
No. N=4 with one brand per vertical isn't a benchmark. This piece is an existence-proof reference table showing what the Index range looks like across some real brands + how the KPI mix can differ meaningfully at matching composite scores. Use it to anchor your reading of your own Index, not to set targets.
How often does the platform update these numbers?
Continuous. Dashboard headline refreshes daily (with day-over-day delta on the same view); Competitors view aggregations refresh on 7-day, 30-day, and 90-day rolling filters. The AI Intelligence view (SITUATION ANALYSIS + finding text) regenerates as tracking data accumulates.
Where can I read the finding-level detail for these brands?
Two companion pieces cover the deep-dives: per-engine Perplexity vs ChatGPT analysis for Brand A and Brand B (engine-focused), and segment-level citation gaps for Brand C and Brand D (segment-focused).
Run this same multi-engine analysis on your brand
Dashboard headline + Competitors KPI strip + AI Intelligence SITUATION ANALYSIS — 15 minutes setup. Multi-engine tracking across ChatGPT, Claude, Gemini, Perplexity, AI Mode, Google AI Overview.
Book a demo →