
Hand your client a report. Not a spreadsheet.
You tracked their brand across every AI engine for a quarter. The work is real. Then reporting day comes and you're screenshotting dashboards into slides at 11pm. Truffle ships the deliverable itself: a one-page executive summary, an 8–12 page client review, and the raw export underneath. One click, any date range, straight from the tracking data you already have.
Illustrative data · demo brand "Flowmetrics"
Your client doesn't buy tracking. They buy the moment once a month when someone explains what happened and what to do next. Right now you assemble that moment by hand: screenshots pasted into slides, numbers retyped into a deck. It's about to get harder, because the channel you have to explain is the one nobody has a report format for yet. If your reporting doesn't cover AI answers, your client assumes you're not working on them.
What an AI visibility report is
An AI visibility report is the client-facing document built from your tracking data: where the brand stands in AI answers, how that moved, who is beating it and where, which sources the AI engines cited, and the to-dos that follow. Truffle generates it in three formats, because the CMO, the account team and the analyst each need a different one.
How the report comes out
Hours per client, every cycle. Numbers get retyped and drift from the source. Charts arrive at whatever resolution the screenshot gave you. Nothing in the file is reusable next quarter, so you rebuild it from scratch, then do it again for the next client.
One click from any date range. The numbers come straight from the data. The layout holds consistent quarter to quarter, your commentary sits where it belongs, and every finding has the verbatim AI answer behind it in the appendix. The hours go into the analysis.
How it works in three steps
From a tracked project to a PDF you can put in front of a client, without opening a slide editor.
The data is already there
Truffle runs your prompts daily across ChatGPT, Claude, Gemini, Perplexity and Google AI Overviews, and weekly in Google AI Mode. By reporting day the period is already tracked. You're not kicking off a scan and hoping it finishes before the call. You're choosing which window to show.
Pick a date range and a format
Choose the period you're reporting on, then the format: executive summary for the 1-pager, client review for the full 8–12 page PDF, or the raw CSV / XLSX if you're feeding another tool. Truffle builds it from the daily tracking data already in the project.
Add your commentary and send
The client review leaves commentary slots open next to each chapter for your read of the quarter, in your voice. That's the part the client is paying for, and the only part Truffle doesn't try to write for you. Fill it in, export, send.
The report your client actually reads
Chapter by chapter, the client review answers the four questions every stakeholder asks. Where do we stand? Who's beating us? Why? What do we do about it? Then it leaves you room to say what all of that means.
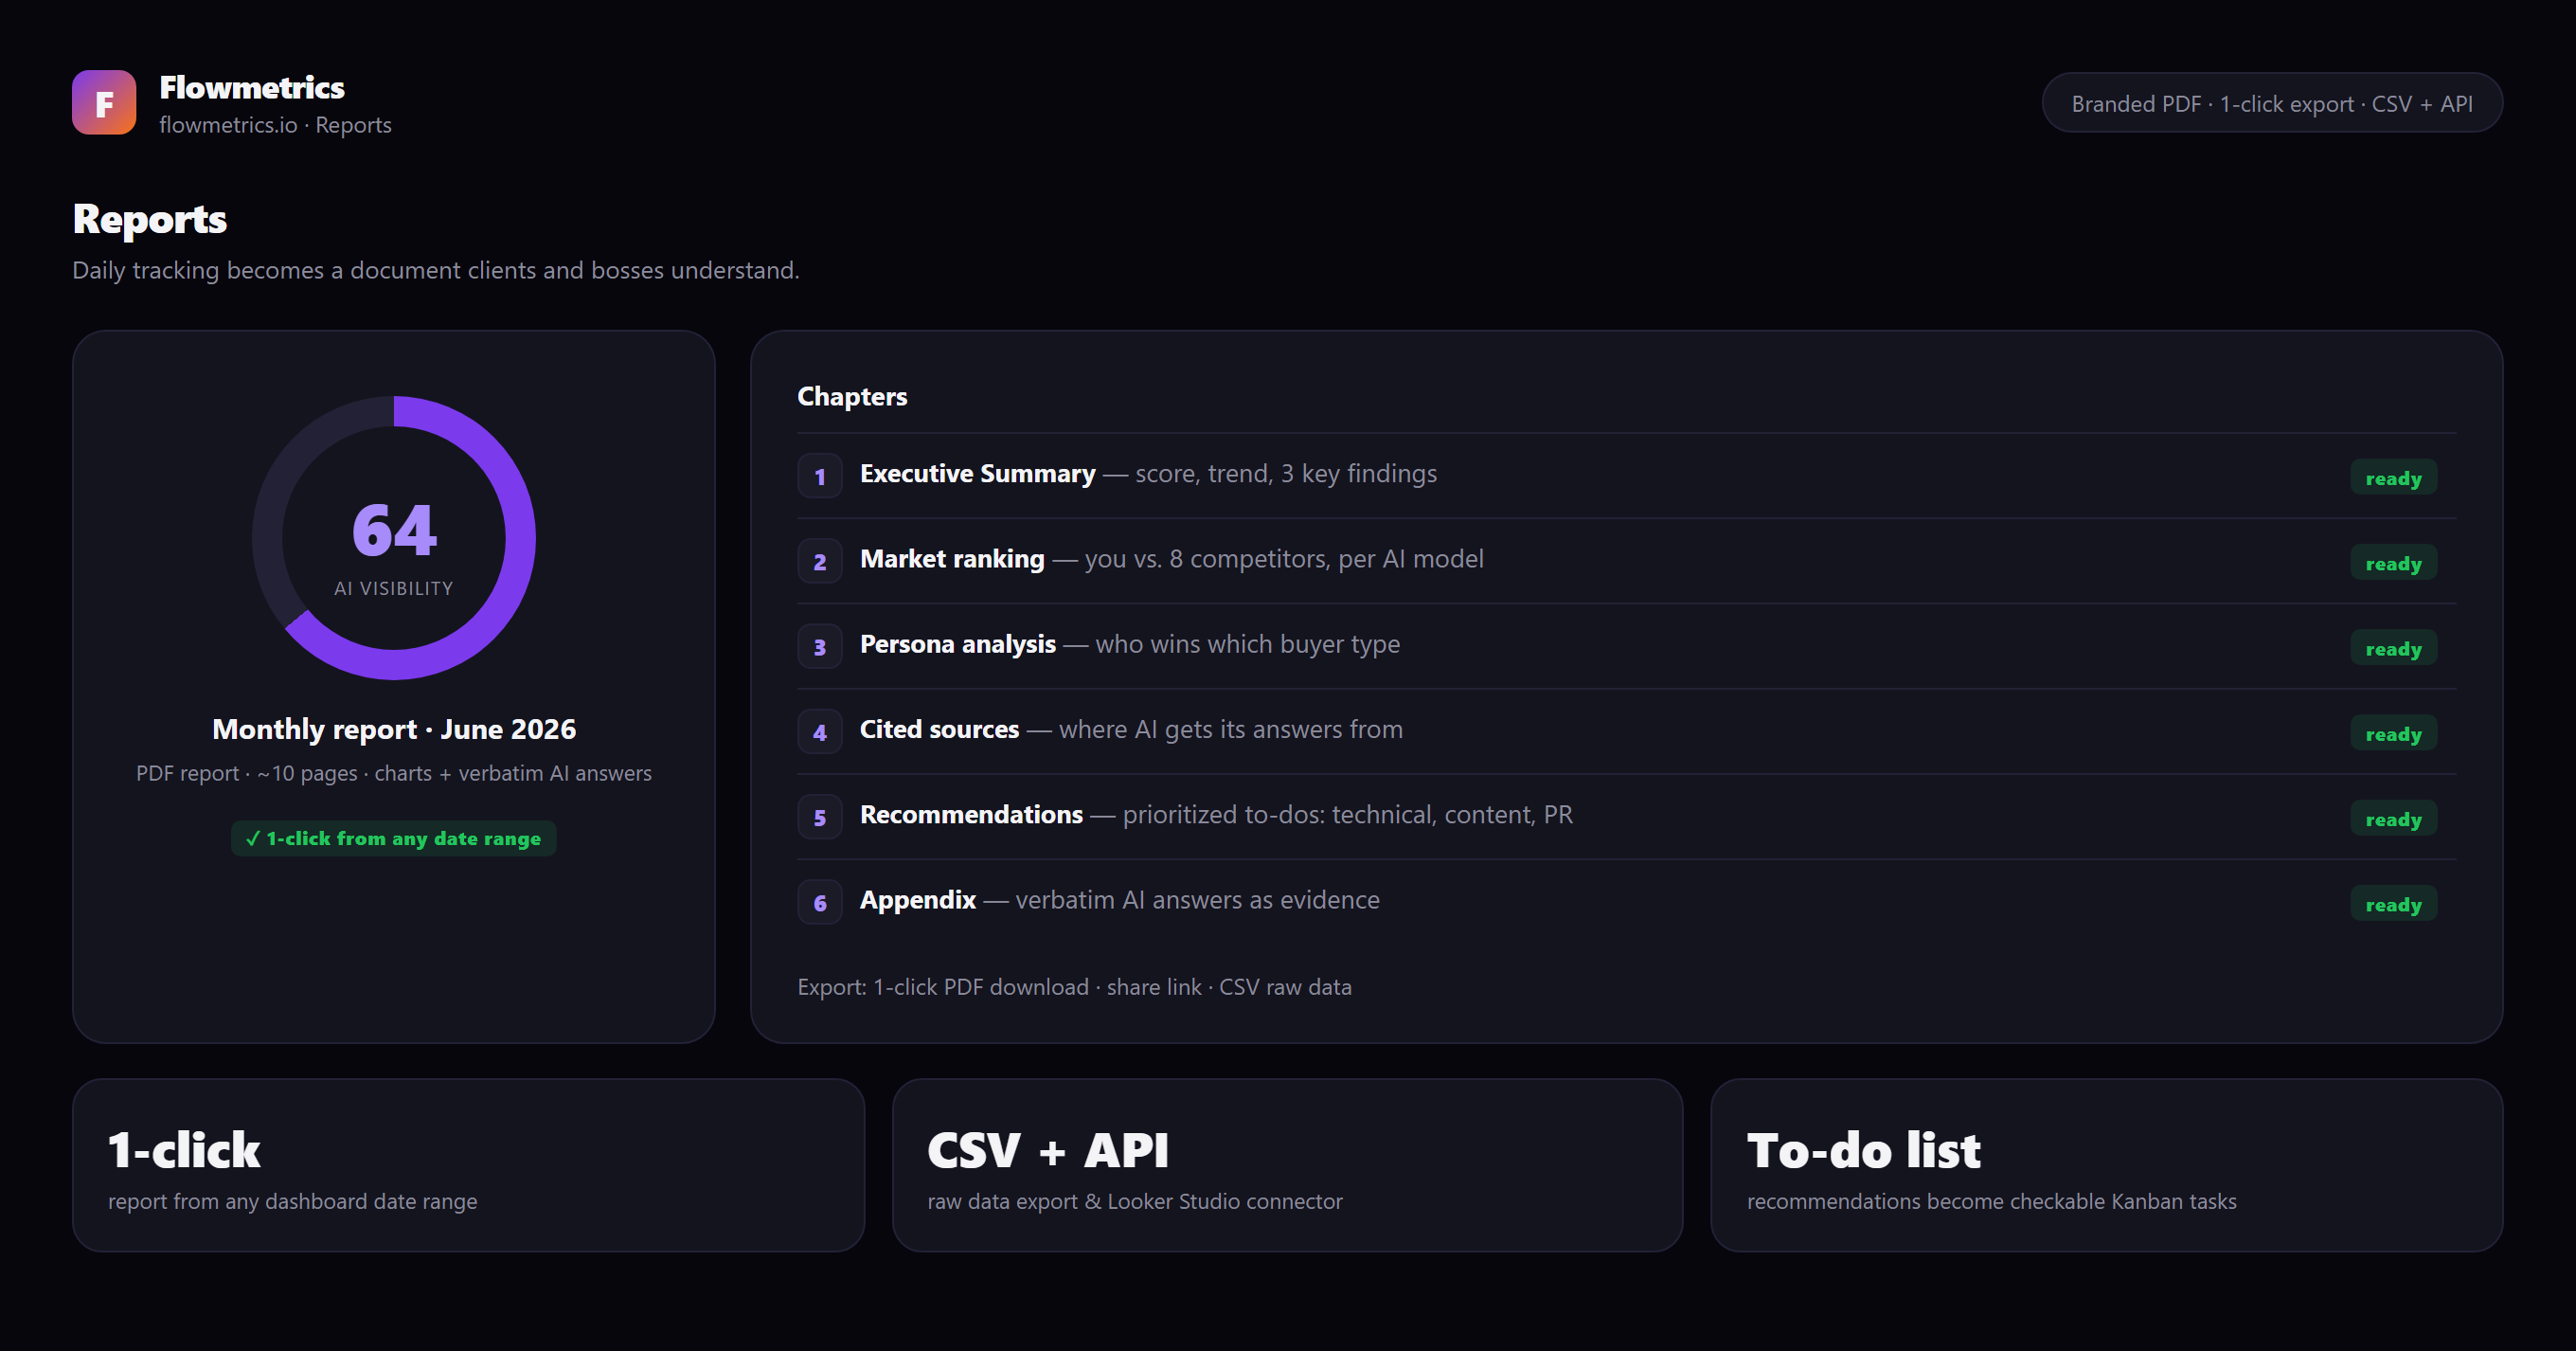
Everything the client asks, in the order they ask it. The score ring on the left is the headline your client remembers: Flowmetrics at 64 AI visibility for the period. The card under it spells out the deliverable. A PDF report, ~10 pages, charts plus the verbatim AI answers, generated 1-click from any date range you pick. To the right, the chapter list fills in as the data lands. The executive summary carries the score, the trend and three key findings. Market ranking puts you against your competitor set, per AI model. Persona analysis shows who wins which buyer type. Cited sources names where the AI engines get their answers. Recommendations become prioritized to-dos across technical, content and PR. The appendix holds the verbatim AI answers as evidence, so a challenged finding has a receipt attached. Underneath sit the export options the mockup lists: 1-click PDF download, share link, CSV raw data. The three tiles carry that further. 1-click reports from any dashboard date range. CSV plus an API, with a Looker Studio connector on Agency plans. And a to-do list, where the recommendations turn into checkable Kanban tasks. Illustrative data for demo brand "Flowmetrics."
Why the commentary slots matter
An auto-generated report with no human voice reads like an auto-generated report, and clients can tell. Truffle stops at the data. It assembles the scan, the ranking, the sources and the recommendations, then hands the interpretation to you. The client is paying for your read of the quarter, so the report should carry it in your words.
What you get with Truffle reports
Every capability below ships today. Nothing here is a roadmap promise.
Frequently asked questions
What formats do reports come in?
Can I put my own branding on the report?
Can I schedule reports, or do I generate them manually?
What's actually in the executive summary?
Can I get the raw data out?
How current is the data in a report?
Stop assembling reports. Start presenting them.
See the full feature set in a 30-minute demo. Track a client's brand across every AI engine, then hand them a report worth presenting.
Cancel anytime · every plan tracks ChatGPT, Claude, Gemini, Perplexity, Google AI Overviews and Google AI Mode.